Monte Carlo Trading Simulator
This tool uses Monte Carlo simulation to model potential trading outcomes based on user-defined parameters. It is intended to help traders understand the range of results that may occur when applying a consistent strategy over time.
The simulation randomly generates trade outcomes according to inputs. This includes the number of trades, win rate, risk per trade and risk-to-reward ratio. The simulation is repeated across multiple runs to show a variety of possible equity curves.
Inputs
Risk can be defined as a fixed dollar amount per trade or as a percentage of the current account balance. When using percentage-based risk, the dollar amount adjusts in response to changes in account size.
- Initial account balance
- Risk per trade (dollar amount or percent of account)
- Win rate
- Risk-to-reward ratio
- Number of trades per simulation
- Number of simulation runs
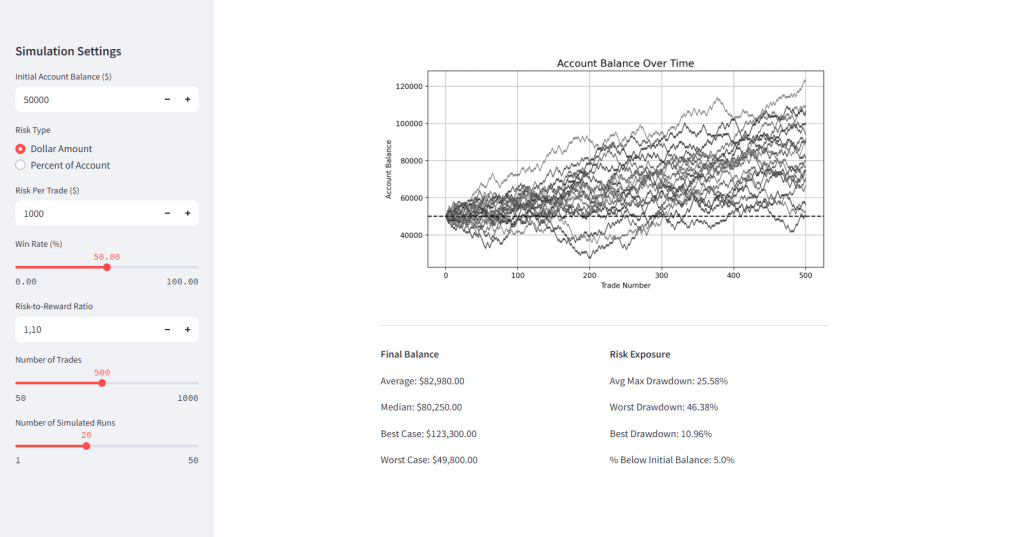
Outputs
Each run produces an equity curve showing account balance over the number of trades. All runs are displayed on the same chart, and key metrics are calculated and presented below.
- Average
- Standard Deviation
- Best Case
- Worst Case
- Avg Max Drawdown
- Worst Drawdown
- Best Drawdown
- % Below Initial Balance
Use Case
This simulation provides a way to evaluate the consistency and risk profile of a trading strategy under randomized trade sequences. It allows for a broader understanding of potential outcomes than a single backtest or forecast.
For example, the tool can be used to evaluate position sizing and risk models. Even trading systems with positive expectancy may experience extended sequences of losses. Simulating these outcomes helps illustrate how excessive risk per trade can lead to significant drawdowns or capital loss, despite an overall profitable system.
