New Momentum H/L
New Momentum H/L shows when momentum, defined as the rate of price change over time, exceeds the highest or lowest values observed over a user-defined period. These events shows points where momentum reaches new extremes relative to that period, and the indicator plots a column to mark each occurrence.
Increase in momentum could indicate the start of a trend phase from a low volatile or balanced state. However in developed trends, extreme momentum could also mark potential climaxes which can lead to trend termination. This reflects the dual nature of momentum.
This indicator compares a 3-period and a 10-period simple moving average and measures the difference. New highs are indicated when all previous values are exceeded within the lookback window; new lows when it drops below all previous values. This will help to show new momentum extremes. The default lookback period is set to 40 bars, which corresponds with two months on a daily chart.
The indicator also computes a z-score of the value over the past 100 bars. This standardization helps compare momentum across different periods and normalizes the values of current moves relative to recent history.
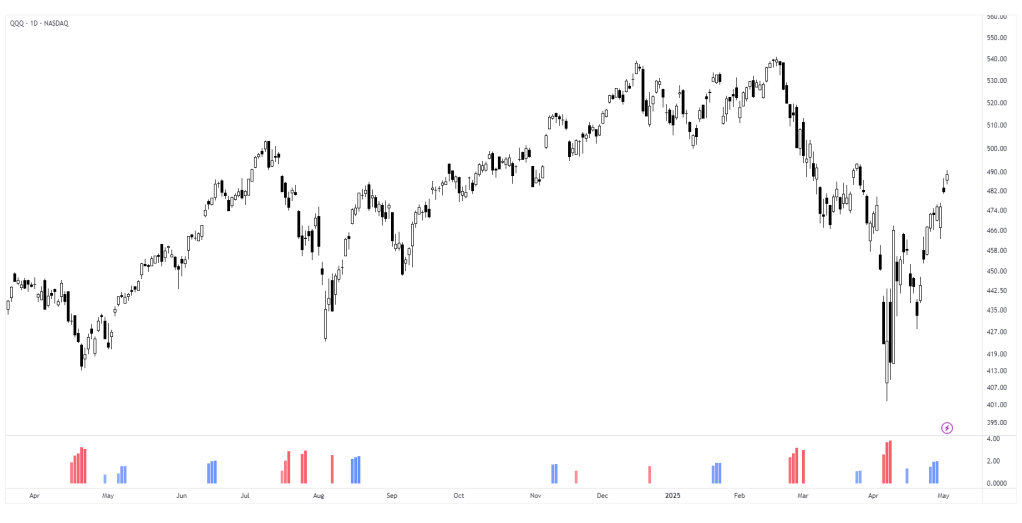
In practice, use the indicator to confirm presence of momentum at the start of a move from a balanced state (often following a volatility expansion), track how momentum develops inside of a trend structure and locate potential climactic events.
Momentum should in preference be interpreted from price movement. However, to measure and standardize provides structure and helps build more consistent models. This should be used in context of price structure and broader market conditions; as all other tools.
