Market Breadth
Market Breath is the equilibrium between number of stocks in advance to those in a decline, in other words a method to determine the current market environment. In a positive phase bullish setups will have improved probabilities and presence, whereas in a bearish phase the opposite would be true.
Primary Indicator

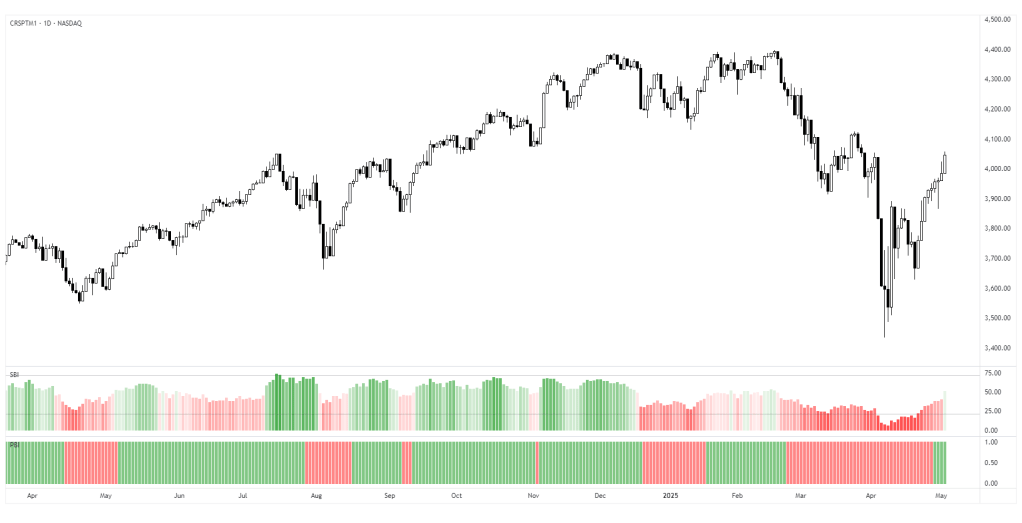
The primary indicator measures the trend and correlation between different EMAs in NASDAQ:CRSPTM1, which tracks the US Total Market Index. This will help to decide whether market could be favorable for bullish- or bearish trading opportunities.
- Green columns indicate a positive phase
- Red columns indicate a negative phase
Secondary Indicator
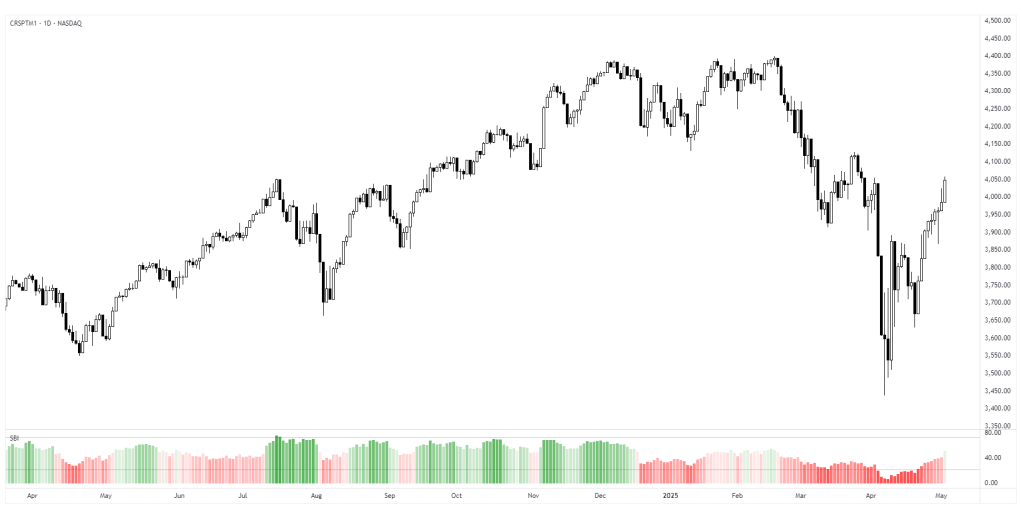
The secondary indicator is a complement, with the purpose to calculate the intensity of each phase. In other words, potential overbought or oversold conditions. The calculations are made based on the MMFI (% of stocks above 50 DMA).
- Values above 72 would be considered overbought, however in a stable bullish phase would on the contrary indicate positive acceleration.
- Values below 21 would be considered oversold, where 10 < would be considered extreme / capitulation.
Practical Application
Use the primary indicator to note whether the market is more favorable for bullish- or bearish setups. Then look at the secondary breadth indicator and note whether there are extreme numbers and take that into account with a discretionary perspective. Example In case the market is in a bearish phase, have extended to the downside for several weeks and the primary breadth indicator is bearish. But he secondary show oversold levels with reversal prints, one should consider to be more careful on short side to risk of mean reversion. In simple terms these can be used to determine whether the current market is appropriate for selected setups.
