Challenges of Fading and Overextension
Introduction
Fading is a strategy where a position is taken against the prevailing move, based on the expectation that it is overextended and likely to reverse. While mean reversion is a valid market phenomenon, some methods are built on incomplete beliefs about how markets operate.
From Normal to Deviation
Markets can be evaluated relative to their recent or average behavior. Price movement within these bounds is considered normal, while a notable move beyond them is referred to as a deviation. This is interpreted as an overextension, where indicators tend to show overbought or oversold values.
However, overextension does not necessarily imply that exhaustion is present. It simply marks a departure from normal behavior. Whether this leads to reversal or continued movement depends on broader market context.
Markets also tend to exhibit volatility clustering; periods of high volatility are followed by further volatility, and calm periods tend to persist. In other words, a strong move often leads to another. This challenges a common bias that an extended move must reverse.
The Limitations of Indicators
Indicators can show when price has moved outside a reference point. For example, oscillators, boundaries, or momentum values may signal overbought or oversold conditions. However, these readings are not signals on their own. The broader context matters more and determines whether the move is likely to reverse or continue.
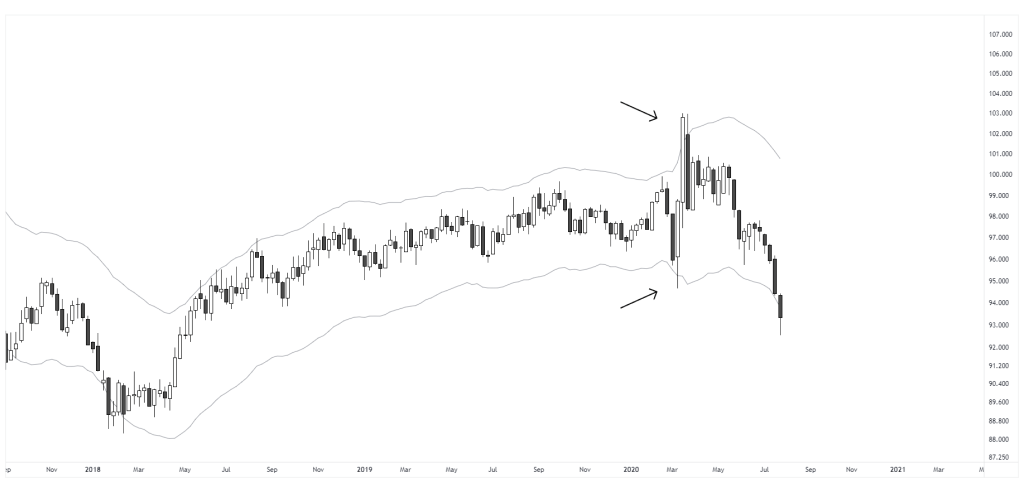
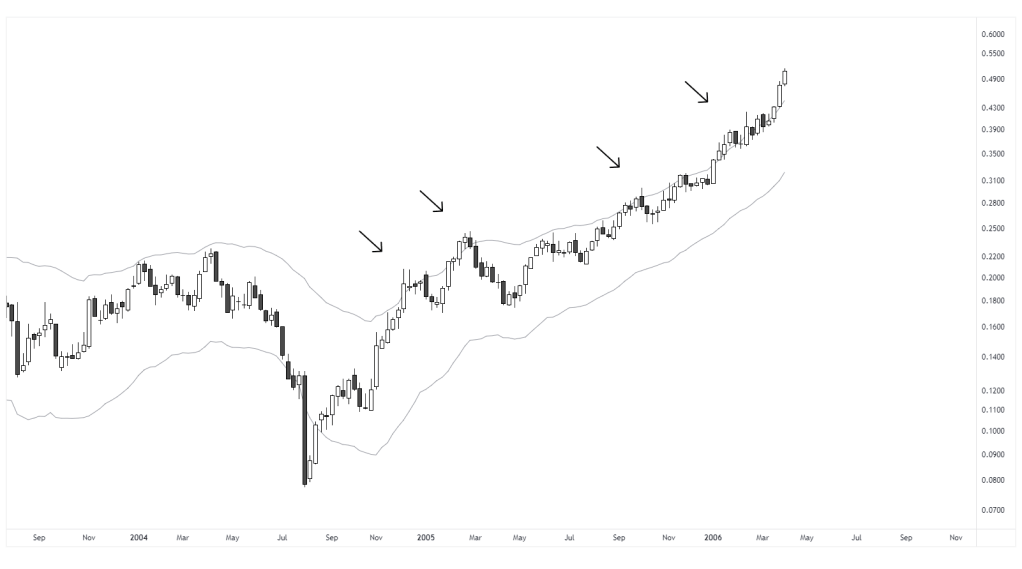
In this chart, price moves outside the upper envelope on two separate occasions, each showing a deviation from recent average behavior. In the first case, the move results in a successful reversion. In the second, price remains extended above the band for several weeks, maintaining persistent momentum. Both instances show similar values, but the outcomes were different. This illustrates that tools should not be interpreted in isolation.
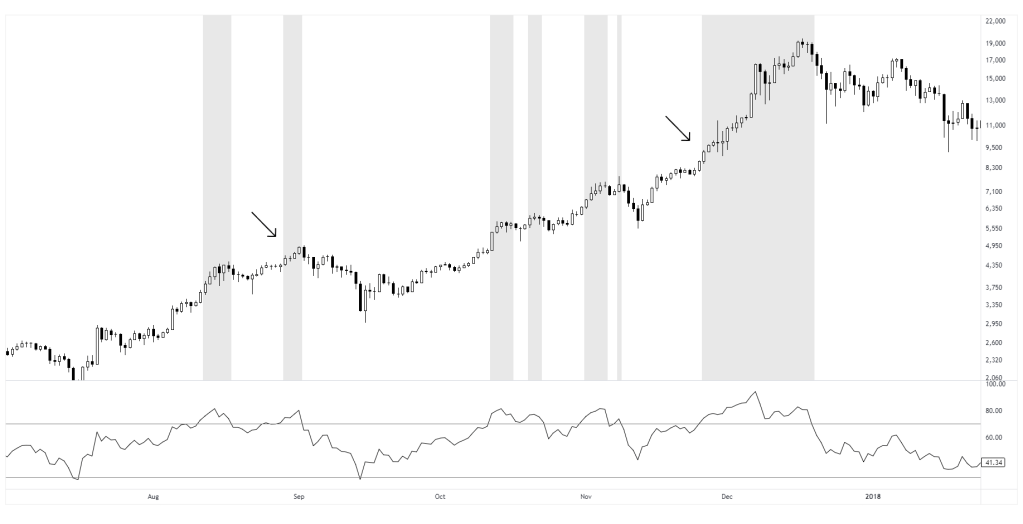
In this chart, RSI reaches overbought levels on two separate occasions. In the first case, the overextension is followed with a mean reversion. In the second, the same condition marks the beginning of a strong upward momentum move. Both events show similar indicator values, but the results were different. This reinforces that identical values can lead to different outcomes depending on the context and underlying structure.
Low Volatile Trends
Low volatility trends present recurring challenges and are worth consideration. These environments are characterized by price moving along structural boundaries with minimal retracement or mean reversion. The absence of counter-movement makes them difficult to fade, as directional drift may persist longer than expected. Attempts to fade these trends or build positions over time can introduce notable risk and limited potential, as reversion remains uncertain. A better approach is to wait for a sharp reversal or the formation of a new structure before considering any setup.
The Risk in Fading Systems
Fading can produce high win rates in range-bound or indecisive markets. Positions tend to be averaged down as price extends further, based on the expectation of a return to the mean. This approach can be effective over a series of trades, but its success depends on eventual reversion.
The risk emerges in less frequent but severe scenarios where momentum persists and price continues to expand beyond expectations. These low-probability but high-impact outcomes tend to be overlooked, but when they occur the consequences can be severe without proper risk control.
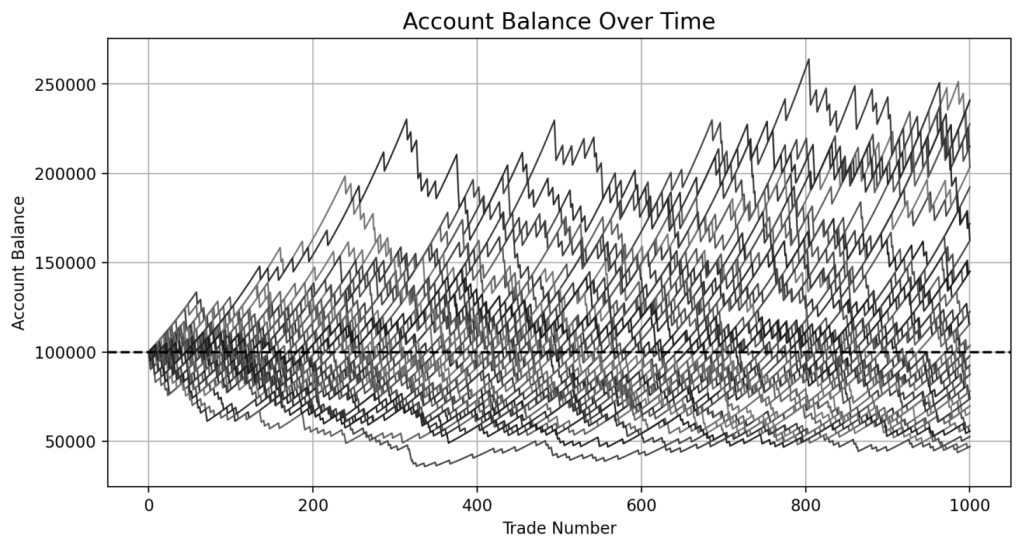
This simulation models a high win-rate fading strategy using an initial account size of $100,000. Each trade targets a gain of 0.5% of the account, or $500 based on the starting balance, and the win rate is set at 91.20%. These values are intended to simulate frequent small wins with the assumption that losses will be infrequent.
Losses in this case are set to 5% of the account size, or $5,000, to represent situations where a trader continues to average into a losing position until a maximum loss threshold is reached. In real conditions, some traders may exceed this amount, either deliberately through increased exposure or due to loss of control.
Across 50 simulation runs of 1,000 trades each, the average final balance was $118,109. The best case ended at $240,858, while the worst case dropped to $47,090. The average maximum drawdown was over 43%, and the worst drawdown reached nearly 70%. Half of all simulations finished below the starting balance. These results illustrate that while most trades may perform as expected, rare but oversized losses can and do occur. Despite a strong win rate, the long-term outcome becomes increasingly dependent on avoiding a handful of catastrophic trades.
Strategies like this often appear stable because of their high success rate, which can create a false sense of security. This perceived consistency can lead to increased confidence, relaxed risk limits, or more aggressive sizing. However, the simulation makes clear that even a few failed trades are enough to reverse months of profits or endanger the entire account. Without strict risk control and structural awareness, the strategy becomes vulnerable to failure with little warning and limited opportunity to recover.
Fading as a Valid Approach
Fading strategies are not inherently wrong. In fact, a lot of profitable and well-developed systems are built on the concept of fading strength or weakness. The concepts explored, such as excursion from the mean, structural failure, or climactic behavior, can all serve as valid references.
The problem arises when a move is assumed to have extended too far and must reverse, without clear reference and in opposition to strong momentum. This, combined with poor risk management, can have notable consequences. Therefore, it is essential to have a proper understanding of market structure and disciplined risk control.
Trend Context and Deviation
For traders who prefer to align with the prevailing trend, an overextension can be evaluated as a potential momentum move. In such cases, one approach is to wait for price to pause or pullback, then enter on continuation. This process can be repeated as long as the trend remains intact. A full reversal should not be considered until there is evidence of structural failure, such as a trend break followed by momentum developing in the opposite direction.
Indicators that show overbought or oversold can be helpful in these events. Their purpose would not be to predict reversion, but to serve as a filter that helps avoid continuation entries when price is extended. This can reduce the risk of entries near potential exhaustion, which is a reasonable practice.
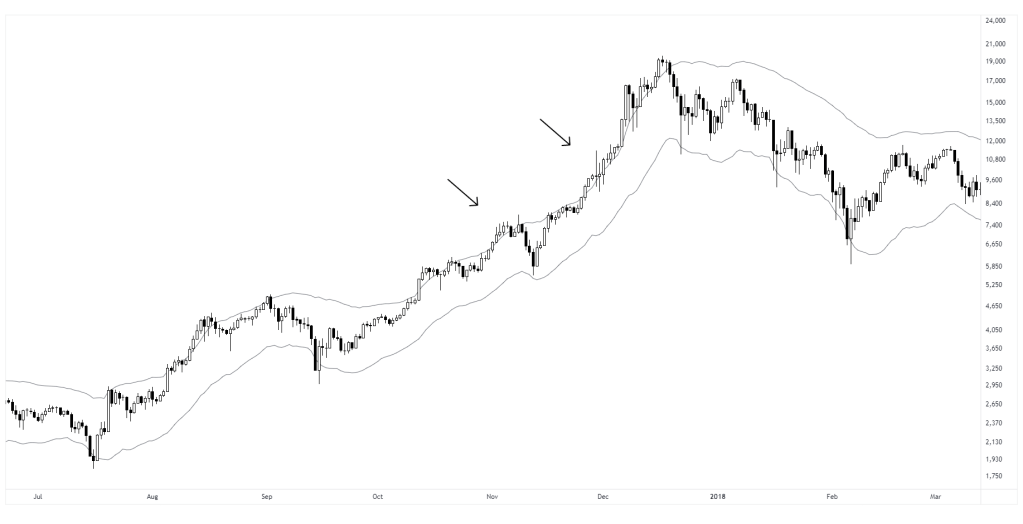
This example shows a case where entries are withheld while price is above the upper envelope, which helps to not chase the move. This illustrates how overbought conditions can serve as a simple filter. Note, towards the end price continued even further, which is to be expected at times. Therefore the purpose is not to predict the reversion but to avoid entries at overextended levels without a pause or pullback.
